Penguins Data Visualization
A tutorial to construct an interesting data visualization of the Palmer Penguins data set.
Import Libraries, Load Data:
Used pandas library to read csv file
import pandas as pd
import matplotlib.pyplot as plt
import seaborn as sns

url = "https://raw.githubusercontent.com/PhilChodrow/PIC16B/master/datasets/palmer_penguins.csv"
penguins = pd.read_csv(url)
Palmer Penguins data set:
| studyName | Sample Number | Species | Region | Island | Stage | Individual ID | Clutch Completion | Date Egg | Culmen Length (mm) | Culmen Depth (mm) | Flipper Length (mm) | Body Mass (g) | Sex | Delta 15 N (o/oo) | Delta 13 C (o/oo) | Comments | |
|---|---|---|---|---|---|---|---|---|---|---|---|---|---|---|---|---|---|
| 0 | PAL0708 | 1 | Adelie Penguin (Pygoscelis adeliae) | Anvers | Torgersen | Adult, 1 Egg Stage | N1A1 | Yes | 11/11/07 | 39.1 | 18.7 | 181.0 | 3750.0 | MALE | NaN | NaN | Not enough blood for isotopes. |
| 1 | PAL0708 | 2 | Adelie Penguin (Pygoscelis adeliae) | Anvers | Torgersen | Adult, 1 Egg Stage | N1A2 | Yes | 11/11/07 | 39.5 | 17.4 | 186.0 | 3800.0 | FEMALE | 8.94956 | -24.69454 | NaN |
| 2 | PAL0708 | 3 | Adelie Penguin (Pygoscelis adeliae) | Anvers | Torgersen | Adult, 1 Egg Stage | N2A1 | Yes | 11/16/07 | 40.3 | 18.0 | 195.0 | 3250.0 | FEMALE | 8.36821 | -25.33302 | NaN |
| 3 | PAL0708 | 4 | Adelie Penguin (Pygoscelis adeliae) | Anvers | Torgersen | Adult, 1 Egg Stage | N2A2 | Yes | 11/16/07 | NaN | NaN | NaN | NaN | NaN | NaN | NaN | Adult not sampled. |
| 4 | PAL0708 | 5 | Adelie Penguin (Pygoscelis adeliae) | Anvers | Torgersen | Adult, 1 Egg Stage | N3A1 | Yes | 11/16/07 | 36.7 | 19.3 | 193.0 | 3450.0 | FEMALE | 8.76651 | -25.32426 | NaN |
| ... | ... | ... | ... | ... | ... | ... | ... | ... | ... | ... | ... | ... | ... | ... | ... | ... | ... |
| 339 | PAL0910 | 120 | Gentoo penguin (Pygoscelis papua) | Anvers | Biscoe | Adult, 1 Egg Stage | N38A2 | No | 12/1/09 | NaN | NaN | NaN | NaN | NaN | NaN | NaN | NaN |
| 340 | PAL0910 | 121 | Gentoo penguin (Pygoscelis papua) | Anvers | Biscoe | Adult, 1 Egg Stage | N39A1 | Yes | 11/22/09 | 46.8 | 14.3 | 215.0 | 4850.0 | FEMALE | 8.41151 | -26.13832 | NaN |
| 341 | PAL0910 | 122 | Gentoo penguin (Pygoscelis papua) | Anvers | Biscoe | Adult, 1 Egg Stage | N39A2 | Yes | 11/22/09 | 50.4 | 15.7 | 222.0 | 5750.0 | MALE | 8.30166 | -26.04117 | NaN |
| 342 | PAL0910 | 123 | Gentoo penguin (Pygoscelis papua) | Anvers | Biscoe | Adult, 1 Egg Stage | N43A1 | Yes | 11/22/09 | 45.2 | 14.8 | 212.0 | 5200.0 | FEMALE | 8.24246 | -26.11969 | NaN |
| 343 | PAL0910 | 124 | Gentoo penguin (Pygoscelis papua) | Anvers | Biscoe | Adult, 1 Egg Stage | N43A2 | Yes | 11/22/09 | 49.9 | 16.1 | 213.0 | 5400.0 | MALE | 8.36390 | -26.15531 | NaN |
344 rows × 17 columns
Clean Data
The raw data contains null values and invalid text value, also, some unecessary columns.
Remove unnecessary columns for visualization, Remove penguins with missing data, check for mistakes in the data (Sex column has . symbol), and shorten species names:
penguins = penguins[['Species', 'Island', 'Culmen Length (mm)', 'Culmen Depth (mm)', 'Flipper Length (mm)', 'Body Mass (g)', 'Sex', 'Delta 15 N (o/oo)', 'Delta 13 C (o/oo)']]
penguins = penguins.dropna()
penguins = penguins[penguins['Sex'] != '.']
penguins["Species"] = penguins["Species"].str.split().str.get(0)

print(penguins['Species'].unique())
print(penguins['Sex'].unique())
print(penguins['Island'].unique())
['Adelie' 'Chinstrap' 'Gentoo']
['FEMALE' 'MALE']
['Torgersen' 'Biscoe' 'Dream']
So all NaN values were dropped, the columns indicating gender only have Male and Female, and Species name is now shorten
Explore physiological variable:
Culmen Length (mm)Culmen Depth (mm)Flipper Length (mm)Body Mass (g)Delta 15 N (o/oo)Delta 13 C (o/oo)
Summary of Data
Using groupby functions to view summary of penguins attributes
# summary of variables mean among species
penguins.groupby(['Species'])[['Culmen Length (mm)', 'Culmen Depth (mm)', 'Flipper Length (mm)', 'Body Mass (g)', 'Delta 15 N (o/oo)', 'Delta 13 C (o/oo)']].mean().round(2)
| Culmen Length (mm) | Culmen Depth (mm) | Flipper Length (mm) | Body Mass (g) | Delta 15 N (o/oo) | Delta 13 C (o/oo) | |
|---|---|---|---|---|---|---|
| Species | ||||||
| Adelie | 38.79 | 18.32 | 190.32 | 3702.70 | 8.86 | -25.81 |
| Chinstrap | 48.79 | 18.40 | 195.67 | 3729.85 | 9.36 | -24.56 |
| Gentoo | 47.57 | 14.99 | 217.19 | 5091.10 | 8.25 | -26.18 |
OBSERVATION:
- Adelie has significant short Culmen Length at a mean of 38.79mm as compared to 48.79mm and 18.42mm for Chinstrap and Gentoo penguins
- Gentoo has the smallest Culmen Depth at a mean of 14.99mm compared to 18.32mm and 18.40mm of Adelie and Chinstrap penguins.
- Gentoo has the longest Flipper Length on average with a mean of 217.19 mm while Adelies’ and Chinstraps’ average flipper lengths are around 190-195 mm.
- Gentoo also have the largest Body Mass at averaging a weight over 5000g compared to the other two species’ with averages around 3700g.
ANALIZE:
- For all of the penguins species, summarized by sex and island, the variable of Delta 15 N (o/oo) and Delta 13 C (o/oo) isotopes shows not much different and the isotopes’ difference within the 3 species are small and insignificant. Therefore, there 2 variable will be removed and we will only look at: Culmen Length, Culmen Depth, Flipper Length, Body Mass.
- The large body mass of Gentoo penguins is something should be focus on since it’s signifantly large than the others
- The flipper Length data and Culmen Depth data shows a similar distinction where Gentoo penguins largely differ from the other 2 species. Thus, only focus in body mass because they are helping us find the same distintion with only 1 column and larger distinction.
- Culmen Length data is important to distinguish Adelie penguins
Overall, using data visualize to graph the corellation between body masses and culmen lengths
Data Visualization:
Use matplotlib libraries to visualize distribution, correlation and clusters of penguins species by attributes
Species,Island,Sex- 6 physiological variables:
Culmen Length (mm),Culmen Depth (mm),Flipper Length (mm),Body Mass (g),Delta 15 N (o/oo),Delta 13 C (o/oo)
Histogram graph for all distributions
Created a histogram function for apply function of pandas
histogram plt.hist(data, label, alpha) graph the frequency distribution of input data.
Create subplots by plt.subplot(nrows, ncols, graph number)
Group the dataframe penguins by “Species” and apply the histogram on each attributes column
# Function for Histogram:
def hist(df, colname, alpha):
    plt.hist(df[colname], alpha = alpha,
             label = ', '.join(df.name) if (type(df.name)==tuple) else df.name)

plt.figure(figsize=(8,8))
# subplot 1: Culmen Dephth
plt.subplot(321)
penguins.groupby("Species").apply(hist, "Culmen Depth (mm)", 0.6)
plt.xlabel('Culmen Depth (mm)')
plt.ylabel('Frequency')

# subplot 2: Flipper Length
plt.subplot(322)
penguins.groupby("Species").apply(hist, "Flipper Length (mm)", 0.6)
plt.xlabel('Flipper Length (mm)')

# subplot 3: Body Mass
plt.subplot(323)
penguins.groupby("Species").apply(hist, "Body Mass (g)", 0.6)
plt.xlabel('Body Mass (g)')
plt.ylabel('Frequency')

# subplot 4: Culmen Length
plt.subplot(324)
penguins.groupby("Species").apply(hist, "Culmen Length (mm)", 0.6)
plt.xlabel('Culmen Length (mm)')

lgd = plt.legend(bbox_to_anchor=(1.15, 0.6))

# subplot 5: Delta 15 N isotope
plt.subplot(325)
penguins.groupby("Species").apply(hist, "Delta 15 N (o/oo)", 0.6)
plt.xlabel('Delta 15 N (o/oo)')
plt.ylabel('Frequency')

# subplot 6: Delta 13 Cisotopes
plt.subplot(326)
penguins.groupby("Species").apply(hist, "Delta 13 C (o/oo)", 0.6)
plt.xlabel('Delta 13 C (o/oo)')

plt.tight_layout()
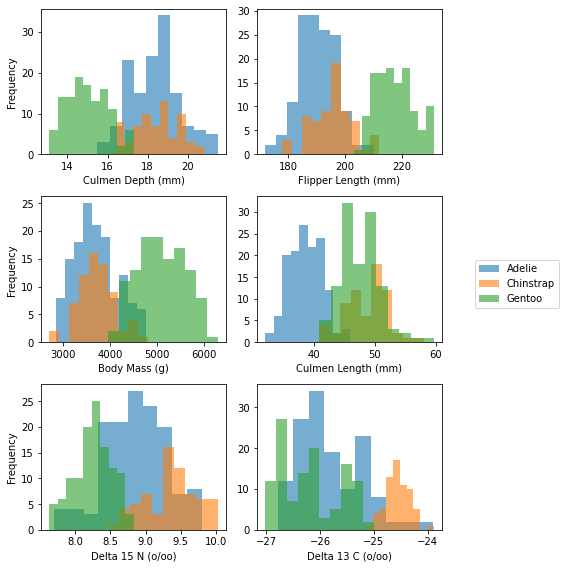
- Distribution of Flipper Length, Culmen Depth, and Body Mass can use to distiguish Gentoo species. However, Body Mass have largest difference.
- Culmen Length distribution distinguish Adelie
Relationship between Body Mass and Island, Sex of each Species
Use sns.displot to shows distribution between Body Mass variable and Island by Species
# distribution plot by Island of Body Mass of each Species
sns.displot(data=penguins, x='Body Mass (g)', hue='Species', col='Island', kind='kde', fill=True)

- On Biscoe island, where there are 2 type of Species (Adelie and Gentoo), the Body Mass of Gentoo is much larger and there are higher density of Gentoo.
- On Dream island, Body Mass cannot be use to distinct Adelie and Chinstrap species because they are overlaps. Chinstrap have higher density on Dream island than Adelie.
# distribution plot by Sex of Body Mass of each Species
sns.displot(data=penguins, x='Body Mass (g)', hue='Species', col='Sex', kind='kde', fill=True)
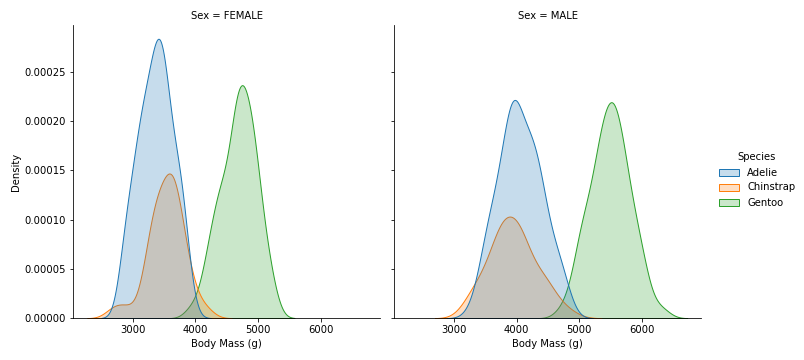
- For both Sex, Gentoo have a very different Body Mass compare to the other 2 species.
- Female penguins have smaller Body Mass than Male penguins.
:3
>.<
:D
Relationship between Culmen length and Island, Sex of each Species
# distribution plot by Island of Culmen Length of each Species
sns.displot(data=penguins, x='Culmen Length (mm)', hue='Species', col='Island', kind='kde', fill=True)

- In both Biscoe and Dream islands where there are more than 1 species per island, Adelie have smaller Culmen Length compare to the other species
# distribution plot by Sex of Culmen Length of each Species
sns.displot(data=penguins, x='Culmen Length (mm)', hue='Species', col='Sex', kind='kde', fill=True)
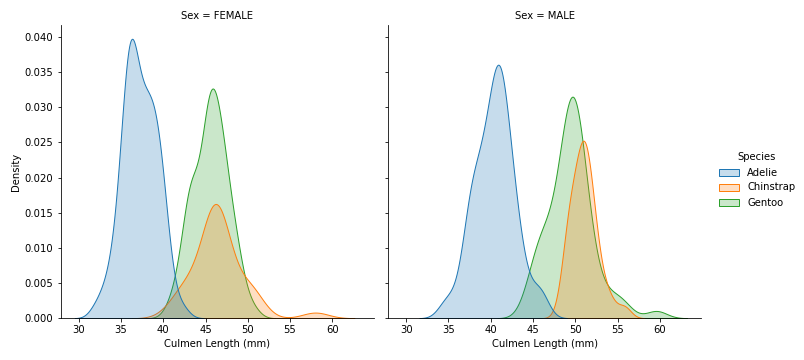
- Female penguins have smaller Culmen Length than Male penguins
- Adelie’s Culmen Length is smaller than the other 2 species.
Relationship between Important Features and Species
Graph scatter plot of each Species by Culmen Length vs Body mass
# Function for Scatter Plot:
def scatter(df, x_cols, y_cols, alpha):
    plt.scatter(df[x_cols], df[y_cols], alpha = alpha, label = ', '.join(df.name) if (type(df.name)==tuple) else df.name)

# Scatter Plot - Culmen Length x Body Mass by Species
fig, ax = plt.subplots(1)

penguins.groupby(['Species']).apply(scatter, 'Culmen Length (mm)', 'Body Mass (g)', alpha = 0.5)

ax.set(title='Graph 1 - Culmen Length vs. Body Mass by Species', xlabel='Culmen Length (mm)', ylabel='Body Mass (g)')
plt.legend(loc=0, framealpha=0)
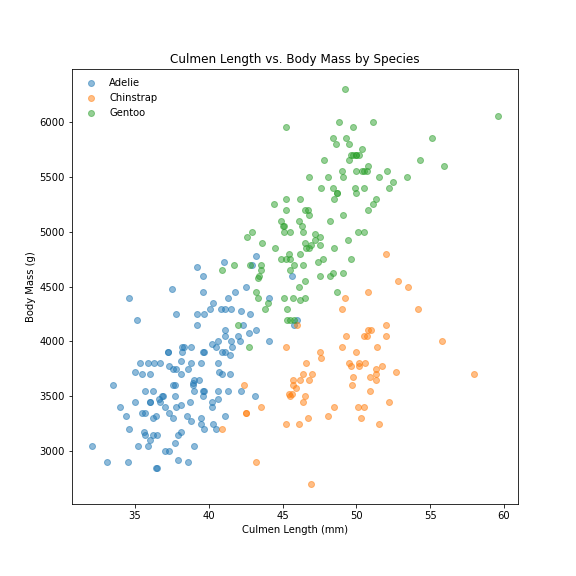
- There is a correlation between these 2 measurements. Penguins with smaller Culmen Lengths and Body Masses are most likely Adelie penguins. While penguins with large Culmen Lengths and Masses are most likely Gentoo.
- The clusters do overlap a lot. Hence, need to look at penguins mean measurements by Island:
penguins.groupby(['Species', 'Island'])[['Culmen Length (mm)', 'Body Mass (g)']].mean().round(2)
| Culmen Length (mm) | Body Mass (g) | ||
|---|---|---|---|
| Species | Island | ||
| Adelie | Biscoe | 38.98 | 3709.66 |
| Dream | 38.40 | 3684.62 | |
| Torgersen | 39.06 | 3717.44 | |
| Chinstrap | Dream | 48.79 | 3729.85 |
| Gentoo | Biscoe | 47.57 | 5091.10 |
penguins.groupby(['Species', 'Sex'])[['Culmen Length (mm)', 'Body Mass (g)']].mean().round(2)
| Culmen Length (mm) | Body Mass (g) | ||
|---|---|---|---|
| Species | Sex | ||
| Adelie | FEMALE | 37.21 | 3366.55 |
| MALE | 40.43 | 4053.68 | |
| Chinstrap | FEMALE | 46.57 | 3527.21 |
| MALE | 51.07 | 3938.64 | |
| Gentoo | FEMALE | 45.56 | 4679.74 |
| MALE | 49.51 | 5488.75 |
Observation:
- Chinstrap penguins only found on Dream Island and Gentoo penguins only on Biscoe Island. But, Adelie penguins are found on all islands.
- Body Mass and Culmen Length measurements are quite different for females and males within species. All females in each species are lower body masses and shorter culmen length
So... another colorful block...
:')
Visualize these measurement by Island and by Sex:
# Scatter Plot: Culmen Length x Body Mass by Island
plt.figure(figsize=(10,15))

# subplot 1: by Island
plt.subplot(211)
penguins.groupby(['Species', 'Island']).apply(scatter, 'Culmen Length (mm)', 'Body Mass (g)', alpha = 0.5)
plt.title('Culmen Length vs. Body Mass by Species and Island')
plt.xlabel('Culmen Length (mm)')
plt.ylabel('Body Mass (g)')
plt.legend(loc=0, framealpha=0)

# subplot 2: by Sex
plt.subplot(212)
penguins.groupby(['Species', 'Sex']).apply(scatter, 'Culmen Length (mm)', 'Body Mass (g)', alpha = 0.5)
plt.title('Culmen Length vs. Body Mass by Species and Sex')
plt.xlabel('Culmen Length (mm)')
plt.ylabel('Body Mass (g)')
plt.legend(loc=0, framealpha=0)
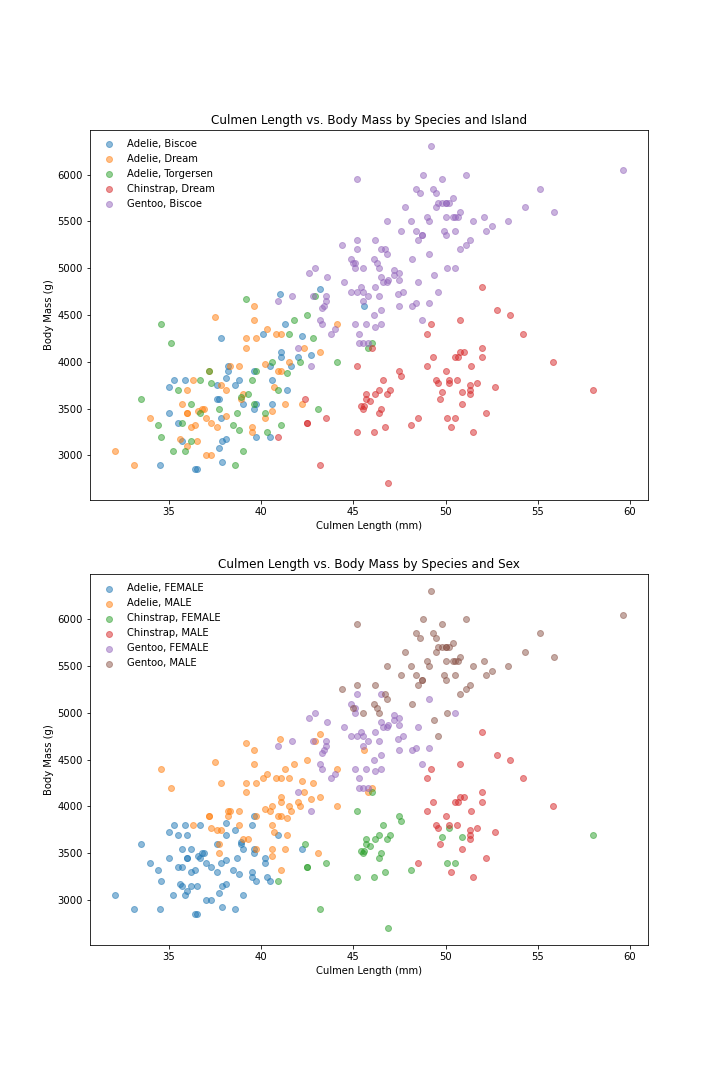
Observation:
- The Island classification shows:
- some Adelies from Biscoe Island have very similar Body Masses and Culmen Lengths to Gentoo penguins (which all come from Biscoe).
- Some Adelie from Dream Island have very similar measurements to Chinstrap from Dream Island
- Knowing which island a penguins is from is not much more helpful than only knowing the measurements of body mass and culmen length
- The Sex classification shows:
- There are 6 clusters based on the 3 measurement we have graphed (Body Mass, Culmen length, Sex)
- Where the Adelie penguins’ body measurement are similar to Gentoo penguins: they are Male Adelie and Female Gentoo
- Where Adelie penguins have similar measurements to Chinstrap penguins: they are Female Adelie and Male Chinstrap
- Where Chinstrap penguins have very close measurements to Gentoo penguins: they are Female Chinstrap and Male Gentoo
Overall:
Sex is a better trait to look at than island because it helps us distinguish penguin species when body mass and culmen length measurements are close to those of another species
Just from these data summary and visualization, we have analyzed that it would be easier to guess which species any given penguins is just by knowing its Culmen Length, Body Mass, and Sex